A Month of Articles.
Published 07 February 2021 at Yours, Kewbish. 2,934 words. Subscribe via RSS.
This post is unlisted and has been archived. This doesn't represent my best work; please check out the posts listed here instead.
Introduction
I’ve been thinking more about the things I read: content, perspective, and contribution to my mindset in some form. As of now, content-wise, I prefer a mix of technology, meta-productivity, or knowledge-building. I don’t have a preference as to perspectives, but contrasting thoughts from very passionate and very noncommital points of view can be interesting. Recently, I’ve been mostly focusing on thinking about how what I read fits in, contribution-to-knowledge-wise.
This series of thoughts started with my self-study of maths, physics, and some CS over the summer. I was reading a lot of drier information each day, but most of it was material I needed to cover (well, not needed, but wanted to, for the sake of preparation) and properly remember. Trying to take clear and concise notes to build a library of reference material I could look back to later was not the most innovative summer project, but at least it helped me build a sense of what I liked in content, and what role I wanted consuming that information to play in my daily life.
While trying to teach myself, I started to notice that there were certain information ‘aesthetics’ that I tended towards. I have a thing both for older, pre-‘CSS is important’ era university sites, where profs simply share their knowledge without any ulterior motive; and newer sites that perhaps contained intriguing interactives, or more casual information sharing. My article aesthetic now is similar - I tend towards indie personal sites, rather than ‘popular’ blogs with share buttons plastered all over. However, finding those articles and websites is pretty difficult - how do I search for ‘small blogs that write generally about programming but in a easy-to-understand way’?
Findka, so far, has been eerily good at recommending things that I’m actually interested in - I suppose the closer and more active user base has something to do with that1. Despite not having the popularity of other forums like r/programming and dev.to, it strikes a nice balance of articles both aligning with and outside my interests. It’s become much easier to find a couple articles to read a day to satisfy my productive procrastination needs, rather than having to scroll through other sites with a much higher noise to signal ratio.
However, I still found that I was trying to skim through a bit too much each day. I was still alt-tabbing to go off on blog post tangents when I’d set out to do something completely different, and I wanted to try to curtail that as much as possible. With the new year, and all the vague self-improvement energy that saturates the internet, I decided to track every article I read for the month of January (spoiler: I have somehow trained myself to subconsciously continue this, well into February). I was looking to see what insights I could gain, and observe if consciously tracking content would make a difference in what and why I was reading.
The Rules
I’ll go into how I tracked and counted these articles exactly in a bit, but I’d like to explain my materials and methods first. (I will try my best not to turn this into a giant lab report, but as I edit this, I can see that I’ve somewhat failed.) I imposed a couple of rules on what counted as an article to track or not, mainly to keep statistics more consistent.
- I’d keep forum-like sites out of the article count - things like Reddit, Lobste.rs discussions, Twitter threads and StackOverflow pages wouldn’t count.
- Speaking of StackOverflow, programming tutorials and other technical references also weren’t included. Documentation for libraries, looking up commands, or following some walkthrough to set something up, for example, fall into this category.
- Content required for schoolwork was not included as well - the point of this experiment was to track what I was reading outside of school, not how much I was studying.
- I allowed myself to skim the first paragraph-ish to determine if I’d like to read the article fully or not without tracking the article, and then log the page. I was definitely also allowed to stop reading the post at any time, but by any point after the first hundred-ish words, the article would already be tracked.
- Every single article besides that would be counted - blog posts, Reddit and Twitter links, Findka recommendations would all count towards the day’s total.
The Graphs
So we’ve come to the graphs, of which there are only two - I think they encapsulate the data well enough. One shows a total of articles read per day, with a three day rolling average, and the other shows a distribution of the times I read any article each day.
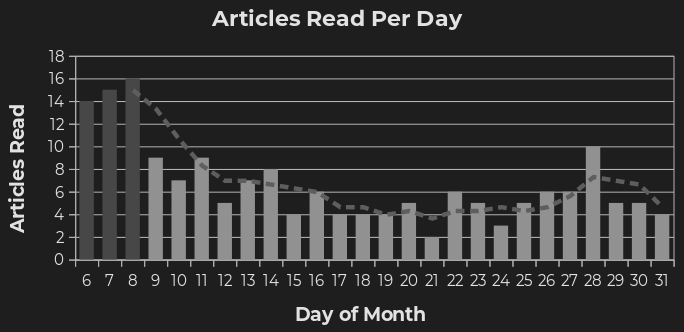
Figure 1. Articles read per day.
You can see a large spike in the beginning of the experiment - I’ve coloured those bars a darker grey because I don’t think they represent what I was actually reading at the time. If I go back through the Google Sheet (more about technical implementations in the appendix) that houses all my responses, there’s a lot of repeated links clustered very close together, so I’m going to assume I was trying to figure out how to make the technical bits and pieces work together.
There’s also a pretty significant dip in the middle of the experiment - it was already coming to the end of term, and there was a steady influx of homework, leaving less time for reading. It’s interesting to see how homework has such a significant impact on what I can consume content-wise, but that’s sort of expected anyhow.
I’d also like to mention that I went from 5 Findka articles a day, to 3, somewhere in that second week, which ended up increasing back to 4 in the third. I’ve been increasingly turning to Matter and Findka (on Matter, yay RSS feeds!) more instead of scrolling through aggregators, so a fluctuation in articles there generally correlates with changes in reading.
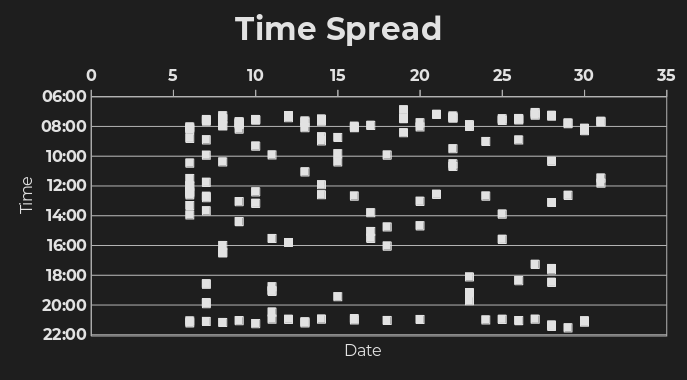
Figure 2. Time distribution for article readings per day.
This figure shows the timestamps of each log. There are two main bands around morning and afternoon - more on that later.
If you’d like some raw numbers:
- I read 174 articles over 26 days - short and long form are included
- That averages to around 6.69 articles a day over the entire range
- Each week, I averaged a different number of articles:
- The first week (I was doing a lot of testing with my Shortcuts and things), I averaged 9.5 per day
- The second week, I averaged 4.6 articles a day
- The third week, I averaged 4.4 articles per day
- For the last week of the experiment, I averaged 5.5 a day
The Findings
I suppose that this would be the discussion part of this pseudo-lab report, so let’s get into some expectations, findings and takeaways.
My hypothesis going into this entire tracking experiment was that by being more conscious about what and when I was reading, I’d manage to self-regulate more impulsive reading sprees, and check the productive procrastination that sometimes ticks in. Before I started this, I had a bit of a reflex to just Ctrl-T, open up a new tab, and sort of spam whatever into the omnibox before my brain consciously processed what I was doing, and then close the tab. (Oddly enough, I ended up not going down those rabbit holes most of the time anyway, but it was a bit annoying to accidentally keep opening and searching around for things to procrastinate with.) I suppose the hypothesis was very well supported - I took more notes and tried to limit myself to a couple reading sessions a day.
In the rules, I explicitly stated that I wouldn’t include Reddit, Twitter, or discussion threads in the totals for each day. I thought that this would lead me to spend proportionally more time there, but I don’t think it’s made a significant difference. I think that having to explicitly log what I was reading while giving myself planned time to read reduced the urge to go look for something to read well enough. At the moment, I go through my Findka, Matter, and Nitter in the morning, and I’ve realized that there’s really no point in checking much more frequently - people don’t create meaningful content in 15 minute intervals. It feels more satisfying to go through a larger chunk of content anyways, though I can’t measure how much of this was due to the tracking in any quantifiable numbers. Creating a regular schedule for reading through things, and trying to keep myself accountable with the log, was surprisingly useful.
Speaking of surprises, tracking every single link I’d read over the past month has built up sort of a library effect. While retention of article content isn’t something I’ve explored in my data at all, I have less of an issue finding really great posts and then losing them in my browser history. I know that everything I’ve read is in a central location, and it’s much easier to find things in one place than to search for that place, and then for the article I’m looking for2. (It’s also probably useful to mention that I do generate summaries of what I’ve read each week to review and see what I’d like to take away from the content I’ve been consuming.) I find that I can at least vaguely remember what I’ve read better - especially since I try to consciously choose better articles to ‘commit’ to when I track them.
Going back to the raw data, and the charts I put in the section above, it’s interesting to see how the amount of schoolwork (a non-tracked item, but something I can very clearly remember) has an impact on my reading. It’s probably just because of how I organize my days - if I really have homework to catch up on, I’ll work in the time that I have scheduled out for checking various social media, which pushes the reading to the next available block of time (which, if I’m busy, would be in a while). It’s also interesting to see that, even with heavy workloads, I kept up with most of my recommendations and reading, never going a day without reading at least something. I think it’s valuable to set aside time to see what others have written about, so that’s a habit I think I’d like to continue.
If I scan the time logged for each article logged, I can see two main blocks - morning and night. (Disregarding the first couple days - those longer series are probably from when I was testing out my system.) It’s interesting that I read very consistently at night, and a bit less, though still very consistently, in the mornings. (Let’s pretend the ones in the middle are me during breaks and not me █████ █████████████ in █████.)
I have no other data to check my totals against (I can’t exactly just search up blog post total articles spent), so I also have absolutely no idea how my consumption compares to the average population. Maybe I spend a lot more time compared to other people, maybe I don’t. I’d be interested to see how others perform this experiment and how it changes their views, but it’s also not a data comparison I’m entirely that interested in.
In terms of sources of error (always a fun section to write in labs), I can’t think of much besides a) not balancing for word counts and b) mixing the testing / development data in with the actual end data. I don’t think it makes too much of a difference for point a if you consider ideas absorbed instead of purely articles read, or their length. In terms of point b, I think it’s fine to just ignore days 6 through 8, and pretend I started the entire experiment a little later.
Conclusion
In lab reports, this is the part where I try to convince you how relevant this research is, and how it can be applied. In terms of relevance and application, there’s not much else besides being a bit more aware of what content you consume. That, and keeping extremely detailed data on your reading habits, which might appeal to some. I wouldn’t recommend this to someone, nor would I advise against it - it’s pretty fun to do, and an interesting dataset to analyze later.
There was an interesting article about the T-shaped approach to content that I read recently, which discusses the types of information that you choose to consume. That was something I tried to keep in mind throughout the experiment, and I think that, considering my findings and my managing to train myself not to unconsciously alt-tab away to be unproductive when I work, the experiment can be considered a success.
In the future, I might like to take a look at how I use forum sites: an area that I specifically left out of this post. That, combined with more productivity-oriented research, might be an interesting area of self-experimentation. I can’t figure out a way to analyze the subject matter or word count of each post, but I’m pretty happy with the data I’ve managed to collect so far. I’m still continuing this experiment - I’ll probably continue to track everything this year. Because of how I designed the Chrome extension and the Shortcut (see appendix A for other relevant technical magic), the friction of adding a new article is close to none, meaning I’ll be more likely to continue using it anyway. It’s become a new reflex anyway, and I think having this big of a dataset and these new trends to analyze at the end of the year will provide additional interesting insights.
P.S. I’ve found another person who does a similar tracking - link to their thread here.
Appendix A: Technical Digressions
This is the part that fellow nerds might find interesting, but that you should feel free to skip. Some of the work I did with the tracking inspired the hyperpersonalization post I wrote earlier, while I was continuing this experiment on my own. I’ll try to briefly explain how everything gets logged, and leave some trails for interested parties to pursue.
I knew right off the bat that I wanted the process of logging to be as friction-free as possible - that meant a maximum of one click away on my laptop, and from the share sheet on my phone. Instead of trying to rig up some complicated API and spin up a Heroku server to host my app, I decided to go a simpler route: a simple Google Form, linked directly to a Google Sheet. The form has a field for the URL of the post and notes (I didn’t end up writing too many notes as I read, but rather later at the end of my week during my review), and automatically fills in the exact time the form was submitted.
However, I obviously wouldn’t fill in a form manually - we have automation to overengineer! Google Forms have a great link function, where you can autofill and submit a form from just a link. From the form link, something like:
https://docs.google.com/forms/d/e/{id}/viewform/
you can get to something like
https://docs.google.com/forms/d/e/{id}/formResponse?usp=pp_url&{key}={val}&{key}={val}&submit=Submit
You can get this from getting a prefilled link within Google Forms itself.
I managed to bodge together a Chrome extension with this fetch (and a couple lines to display a badge), which I then bound to a keyboard shortcut. I also slapped this fetch into a iOS Shortcut by enabling share sheet for the shortcut, and getting the URL from the input to put into a ‘Get Contents of URL’ block. I can then log articles from my phone and my laptop super easily, which was a major reason the experiment went so well. I expect there’s a similar shortcut-maker for Android, but iOS Shortcuts feel so snappy to make. You might also want to reference this brilliant guide, and adapt it for whatever platform you’re planning to track on.
I then wrote a simple Python script to persist a ‘row last read’ count of the Sheet in a file, and parsed the CSV values since the last pull with csv and requests. That all gets sent into a Markdown file for me to process and read through at the end of the week. I can also download a full CSV file to process the data in an external app directly from Sheets.
None of the above is open source at the moment, but I trust the guide and the Internet can get you to what I’ve managed to do in much shorter time than it took me to even try to figure out how to do it.
In terms of the graphs, those were generated with a little bit of pivot table magic in LibreOffice Calc. The first required summing each day together, and the other was created by just inserting a normal chart and editing the major gridlines to fit with the whole times-as-decimals that LO does. It took much more time than I’m willing to admit, but all in the name of science, right?
-
I can’t figure out if it’s just a relatively small number of users, or really similar tastes, but it’s got to the point that my friend(s?) have made a game out of trying to figure out which articles I submit, with scary accuracy. ↩︎
-
This is part of the reason why I also built Matter - it’s one place to look for things, as opposed to over several different aggregators. ↩︎